Louisiana's four-year cohort graduation rate reached 85% in 2025, the highest mark in the state's recorded data and a 4.9 percentage-point climb from its 2019 low of 80.1%.
The trajectory has been uneven. After dipping to 80.1% in 2019, the rate bounced to 83.5% in 2021, then retreated slightly to 82.7% before resuming its climb. The 2025 figure represents the largest single-year gain in the dataset: 1.5 percentage points, lifting the rate past its 2021 and 2024 plateau of 83.5%.
Four of the five most recent years have shown improvement. The one exception was 2022, when the rate dipped 0.8 points before recovering.
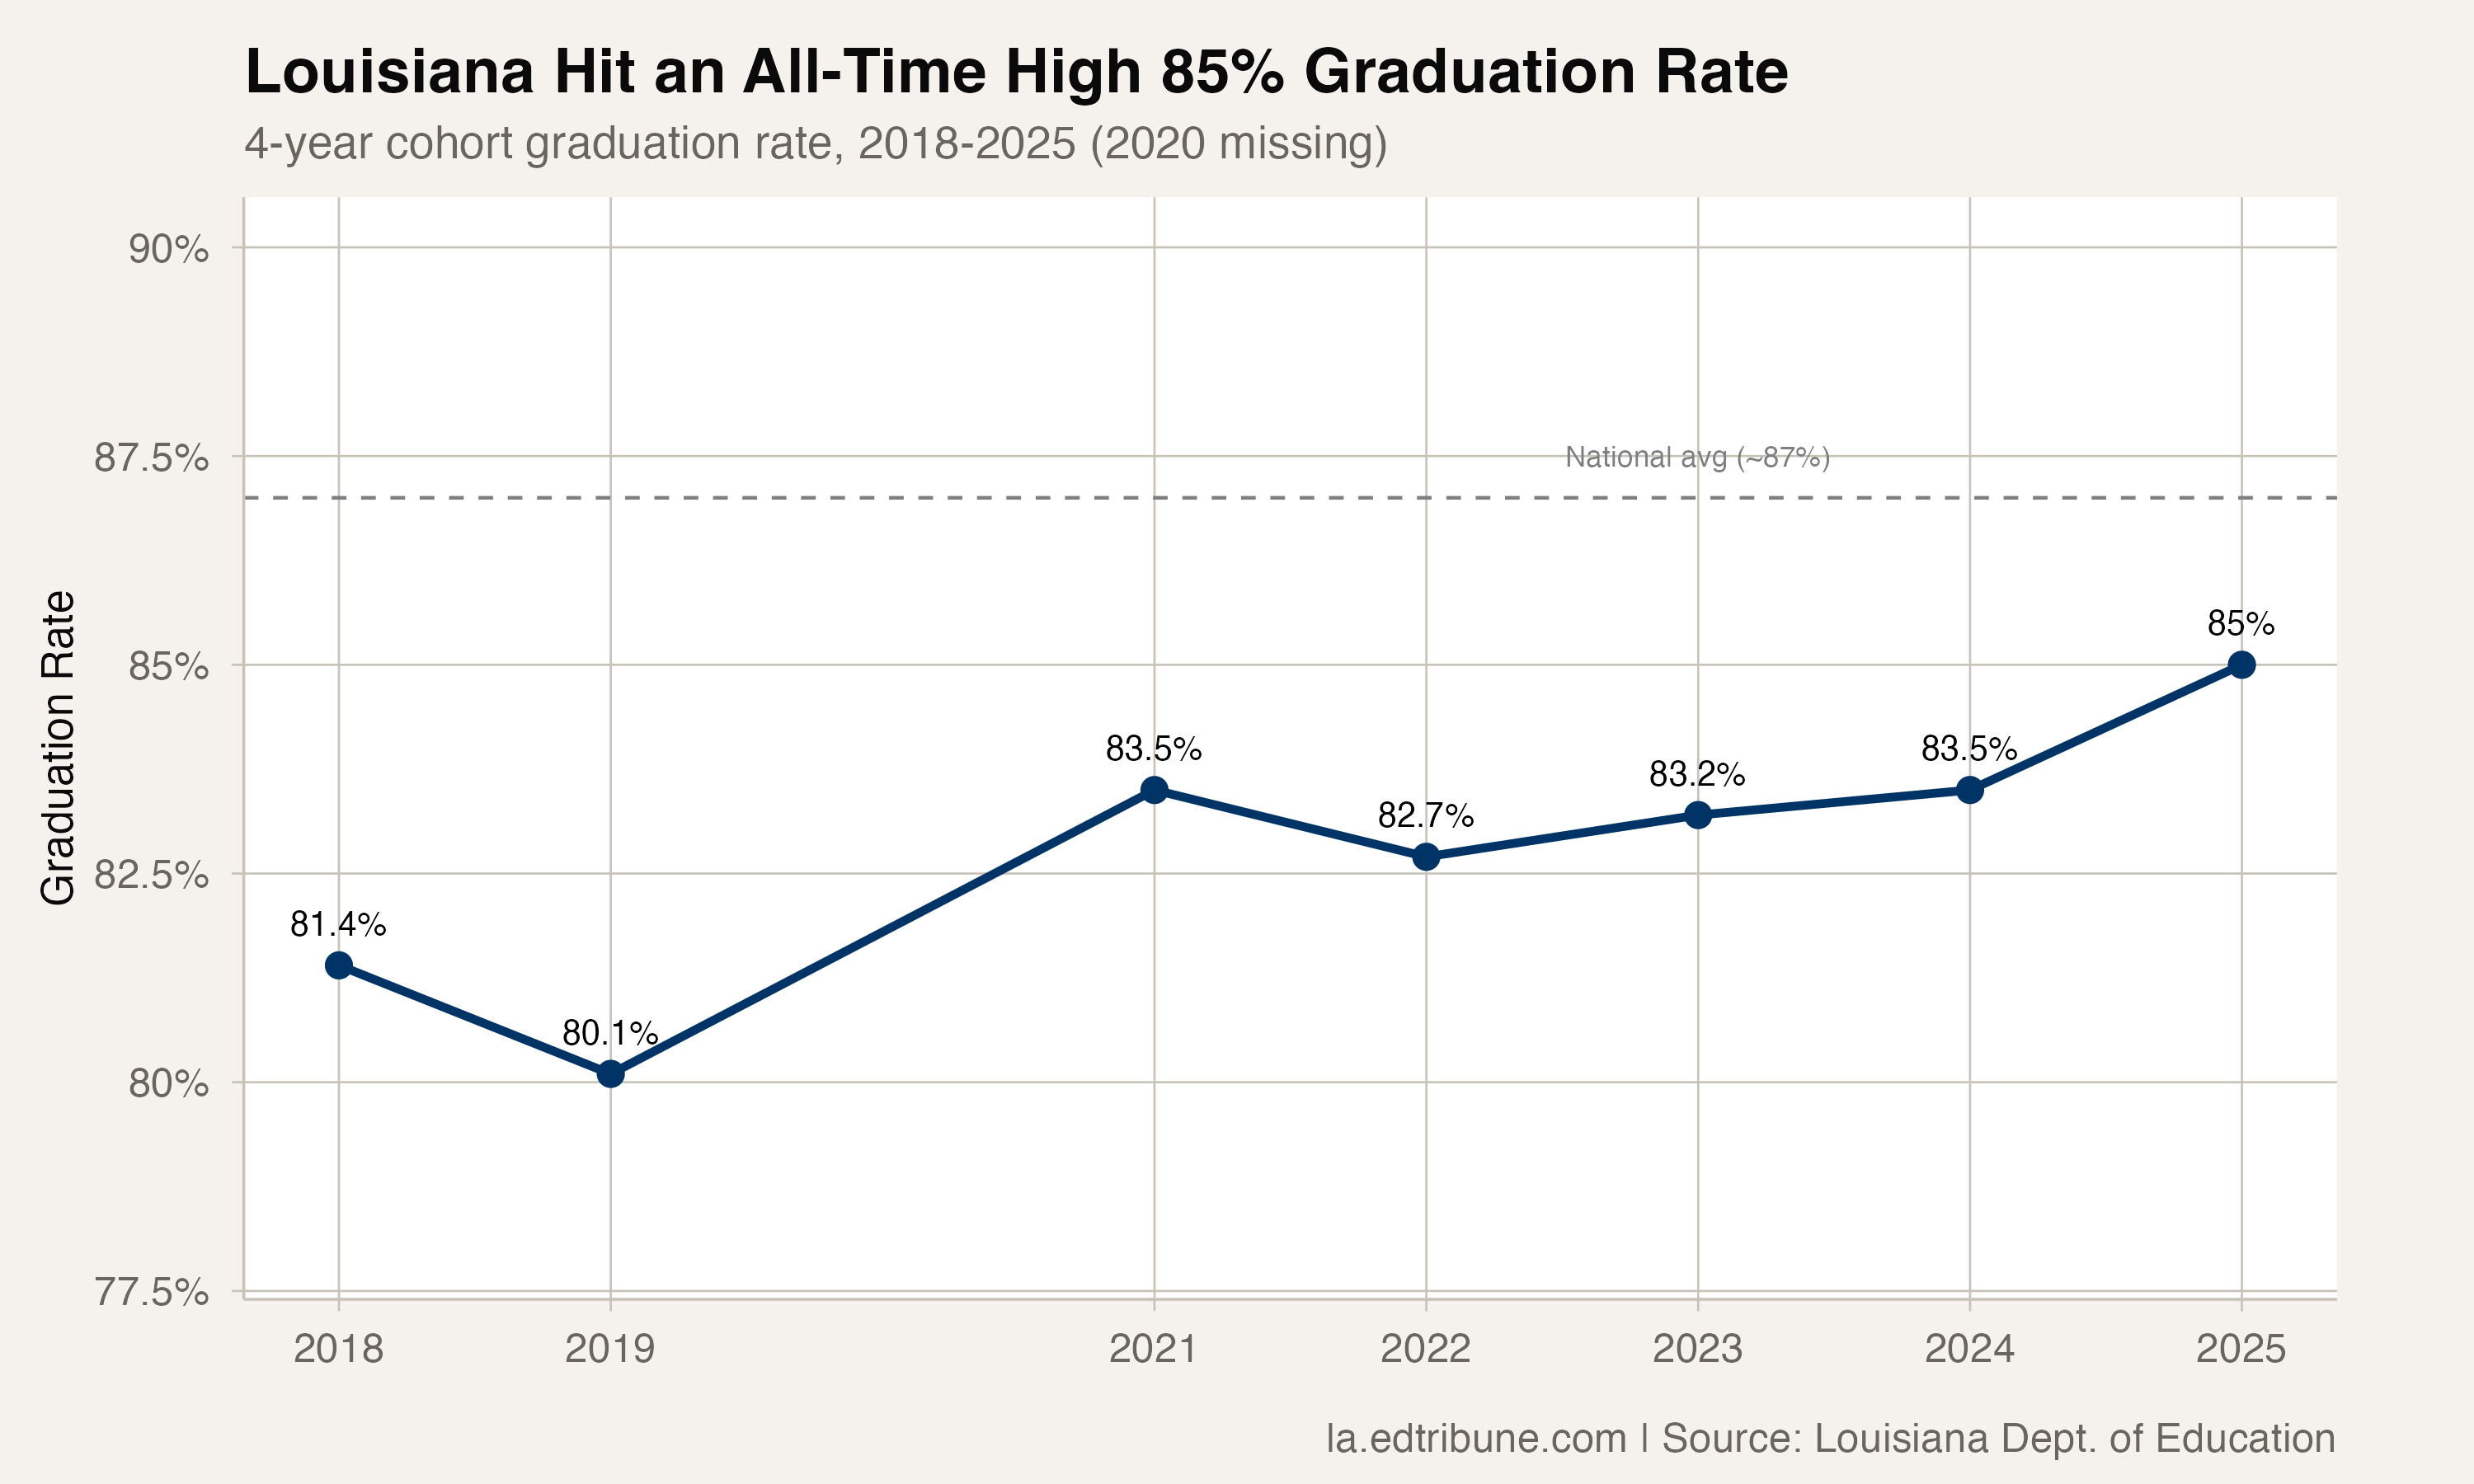
Still below the national average
At 85%, Louisiana remains roughly 2 percentage points below the national average of approximately 87%. That gap has been narrowing: in 2018, when the state stood at 81.4%, the distance to the national rate was closer to 5 or 6 points.
The state's School Performance Score system, which was revised in 2024 to a 100-point scale emphasizing career education and college readiness, posted its fourth consecutive year of improvement in 2025, reaching 80.9 points. The graduation rate gains are occurring alongside broader academic improvement, not in isolation.
Gains across every racial subgroup
The improvement is not concentrated in any single demographic group. Between 2018 and 2025, every major racial subgroup posted gains:
- Hispanic students gained 5.1 points (67.7% to 72.8%), the largest improvement by race
- Black students gained 4.8 points (78.1% to 82.9%)
- White students gained 4.1 points (85.5% to 89.6%)
- Asian students gained 2.0 points (92.4% to 94.4%), from an already-high base
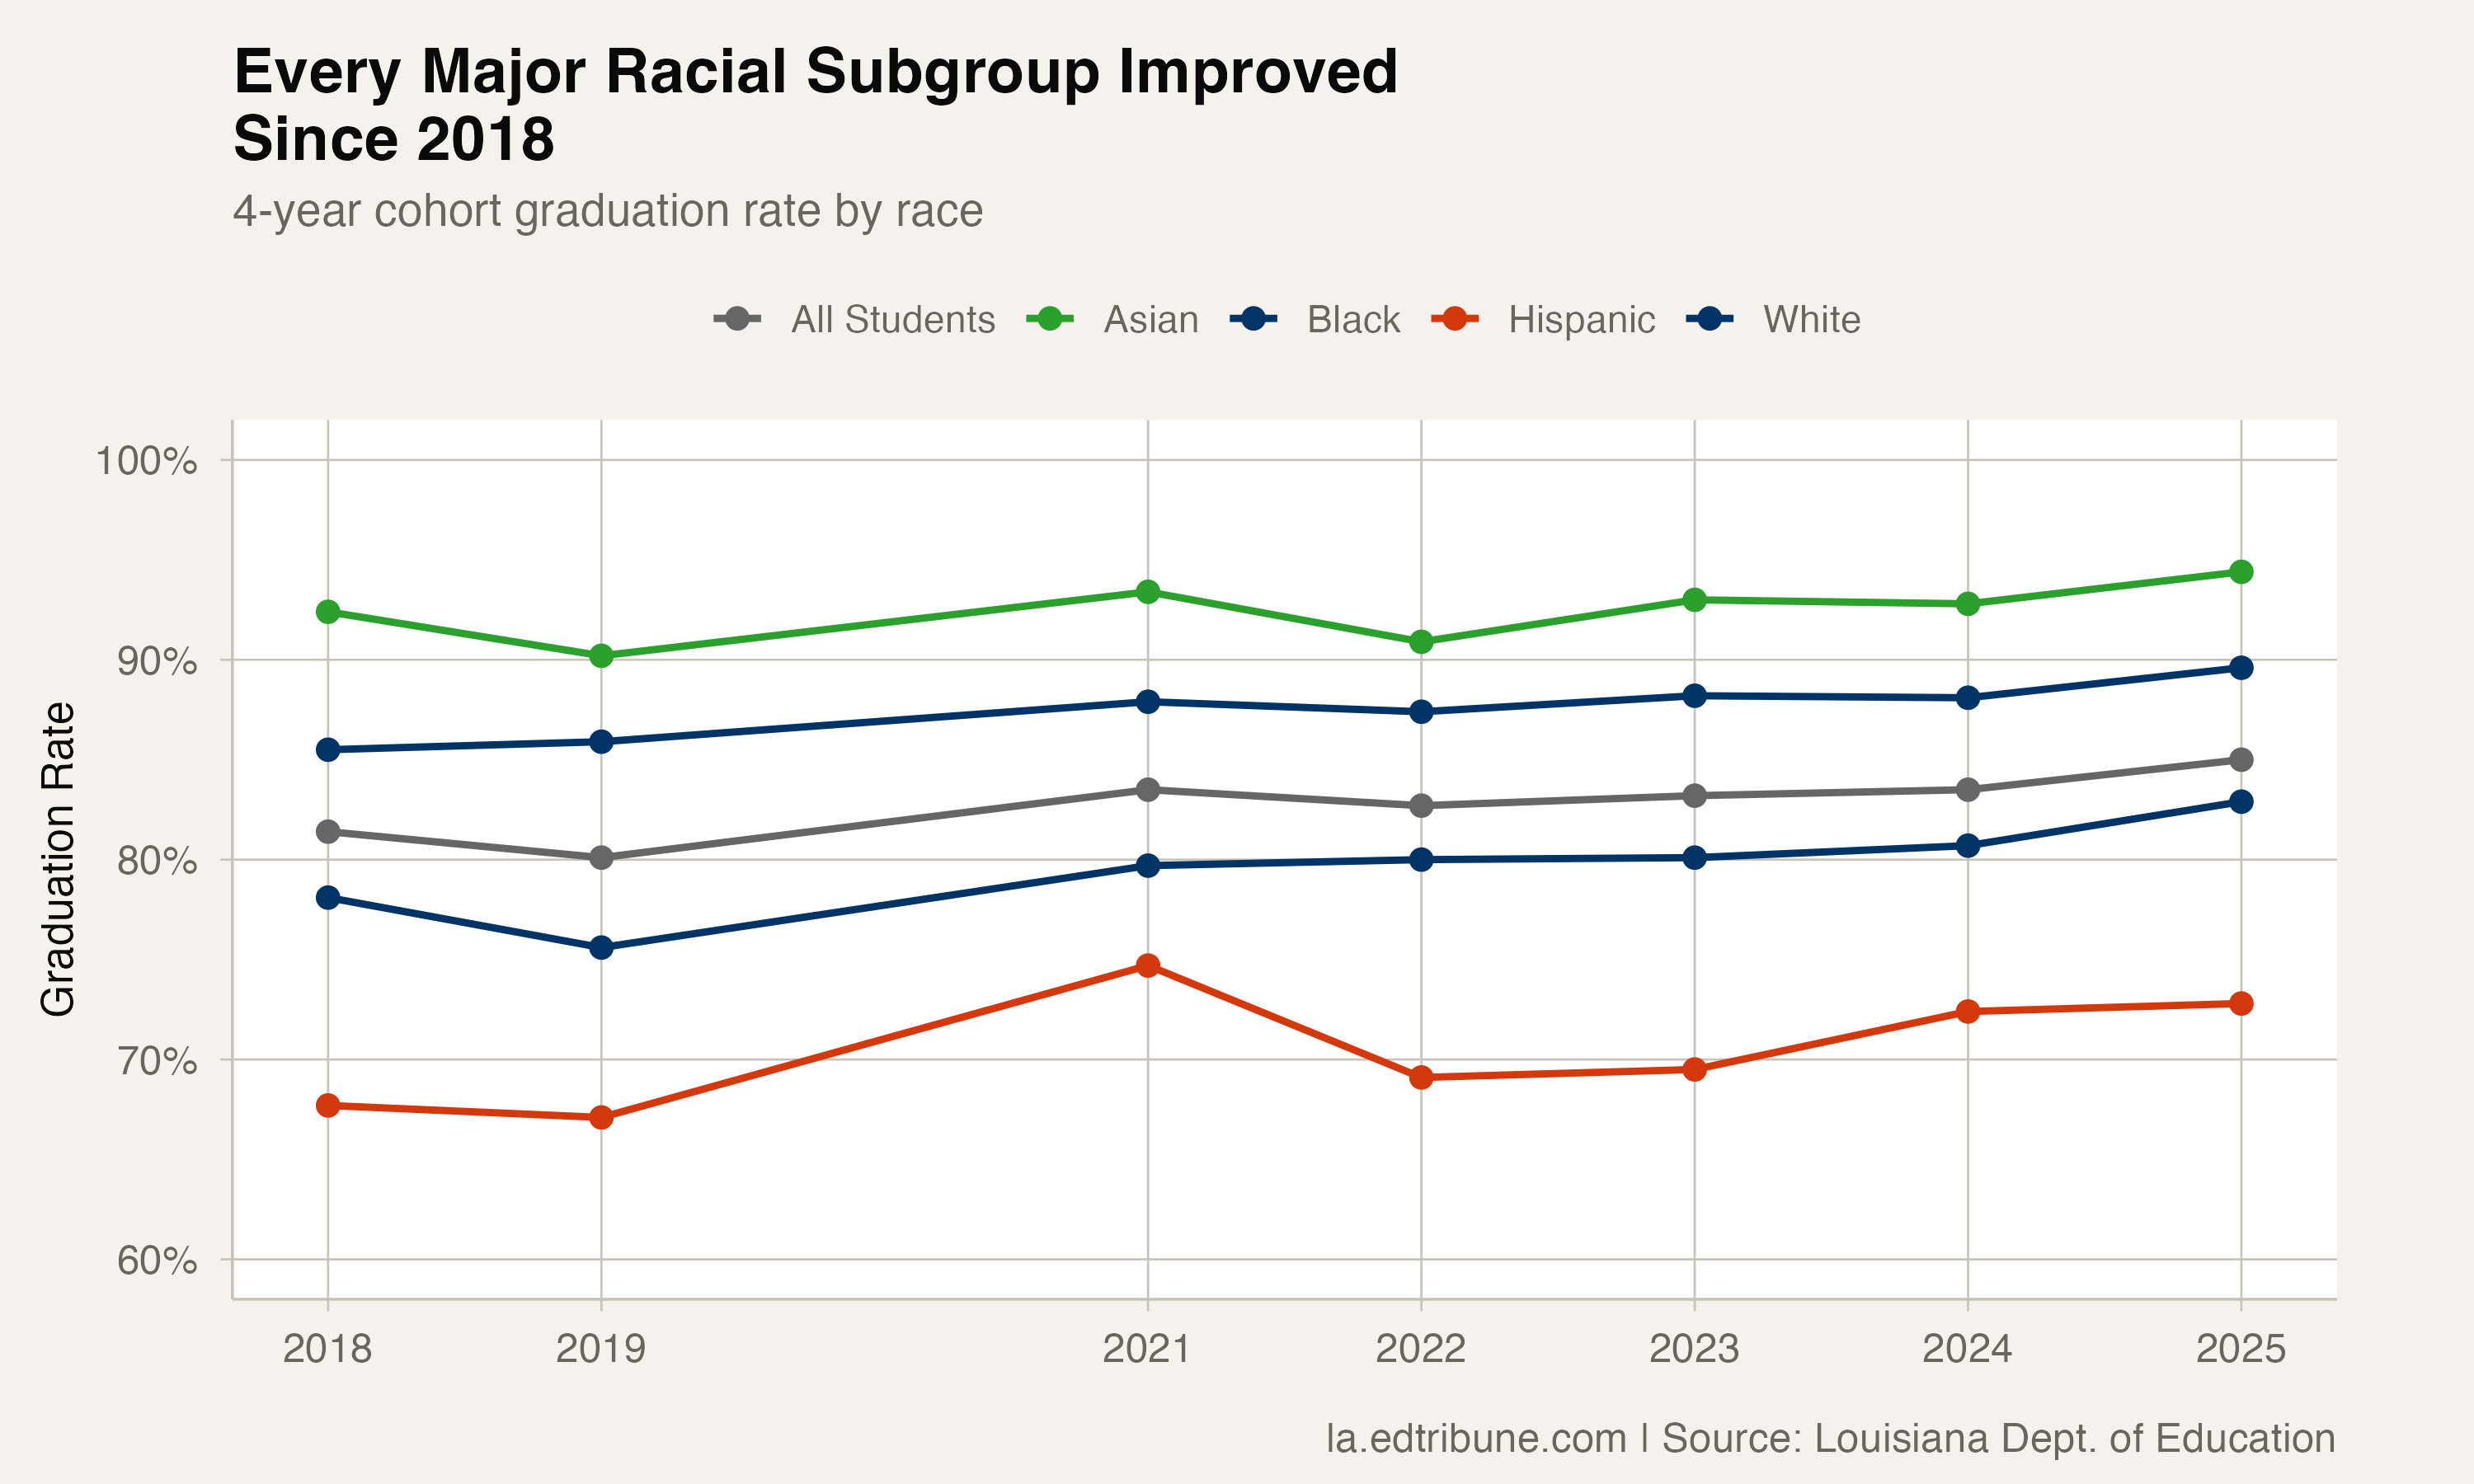
The breadth of improvement matters because it suggests structural rather than compositional change. If the overall rate were rising simply because the student body was shifting toward higher-graduating groups, subgroup rates would remain flat. Instead, every group is climbing.
Black students at 82.9% are now within 2.1 points of the state average. Hispanic students, at 72.8%, remain 12.2 points behind, the widest racial gap in the state.
Year-over-year pattern
The year-over-year changes show an unsteady path upward rather than a smooth linear trend:
- 2019: minus 1.3 points (the only decline in the dataset)
- 2021: plus 3.4 points (post-COVID bounce; 2020 data missing)
- 2022: minus 0.8 points
- 2023: plus 0.5 points
- 2024: plus 0.3 points
- 2025: plus 1.5 points (largest gain)
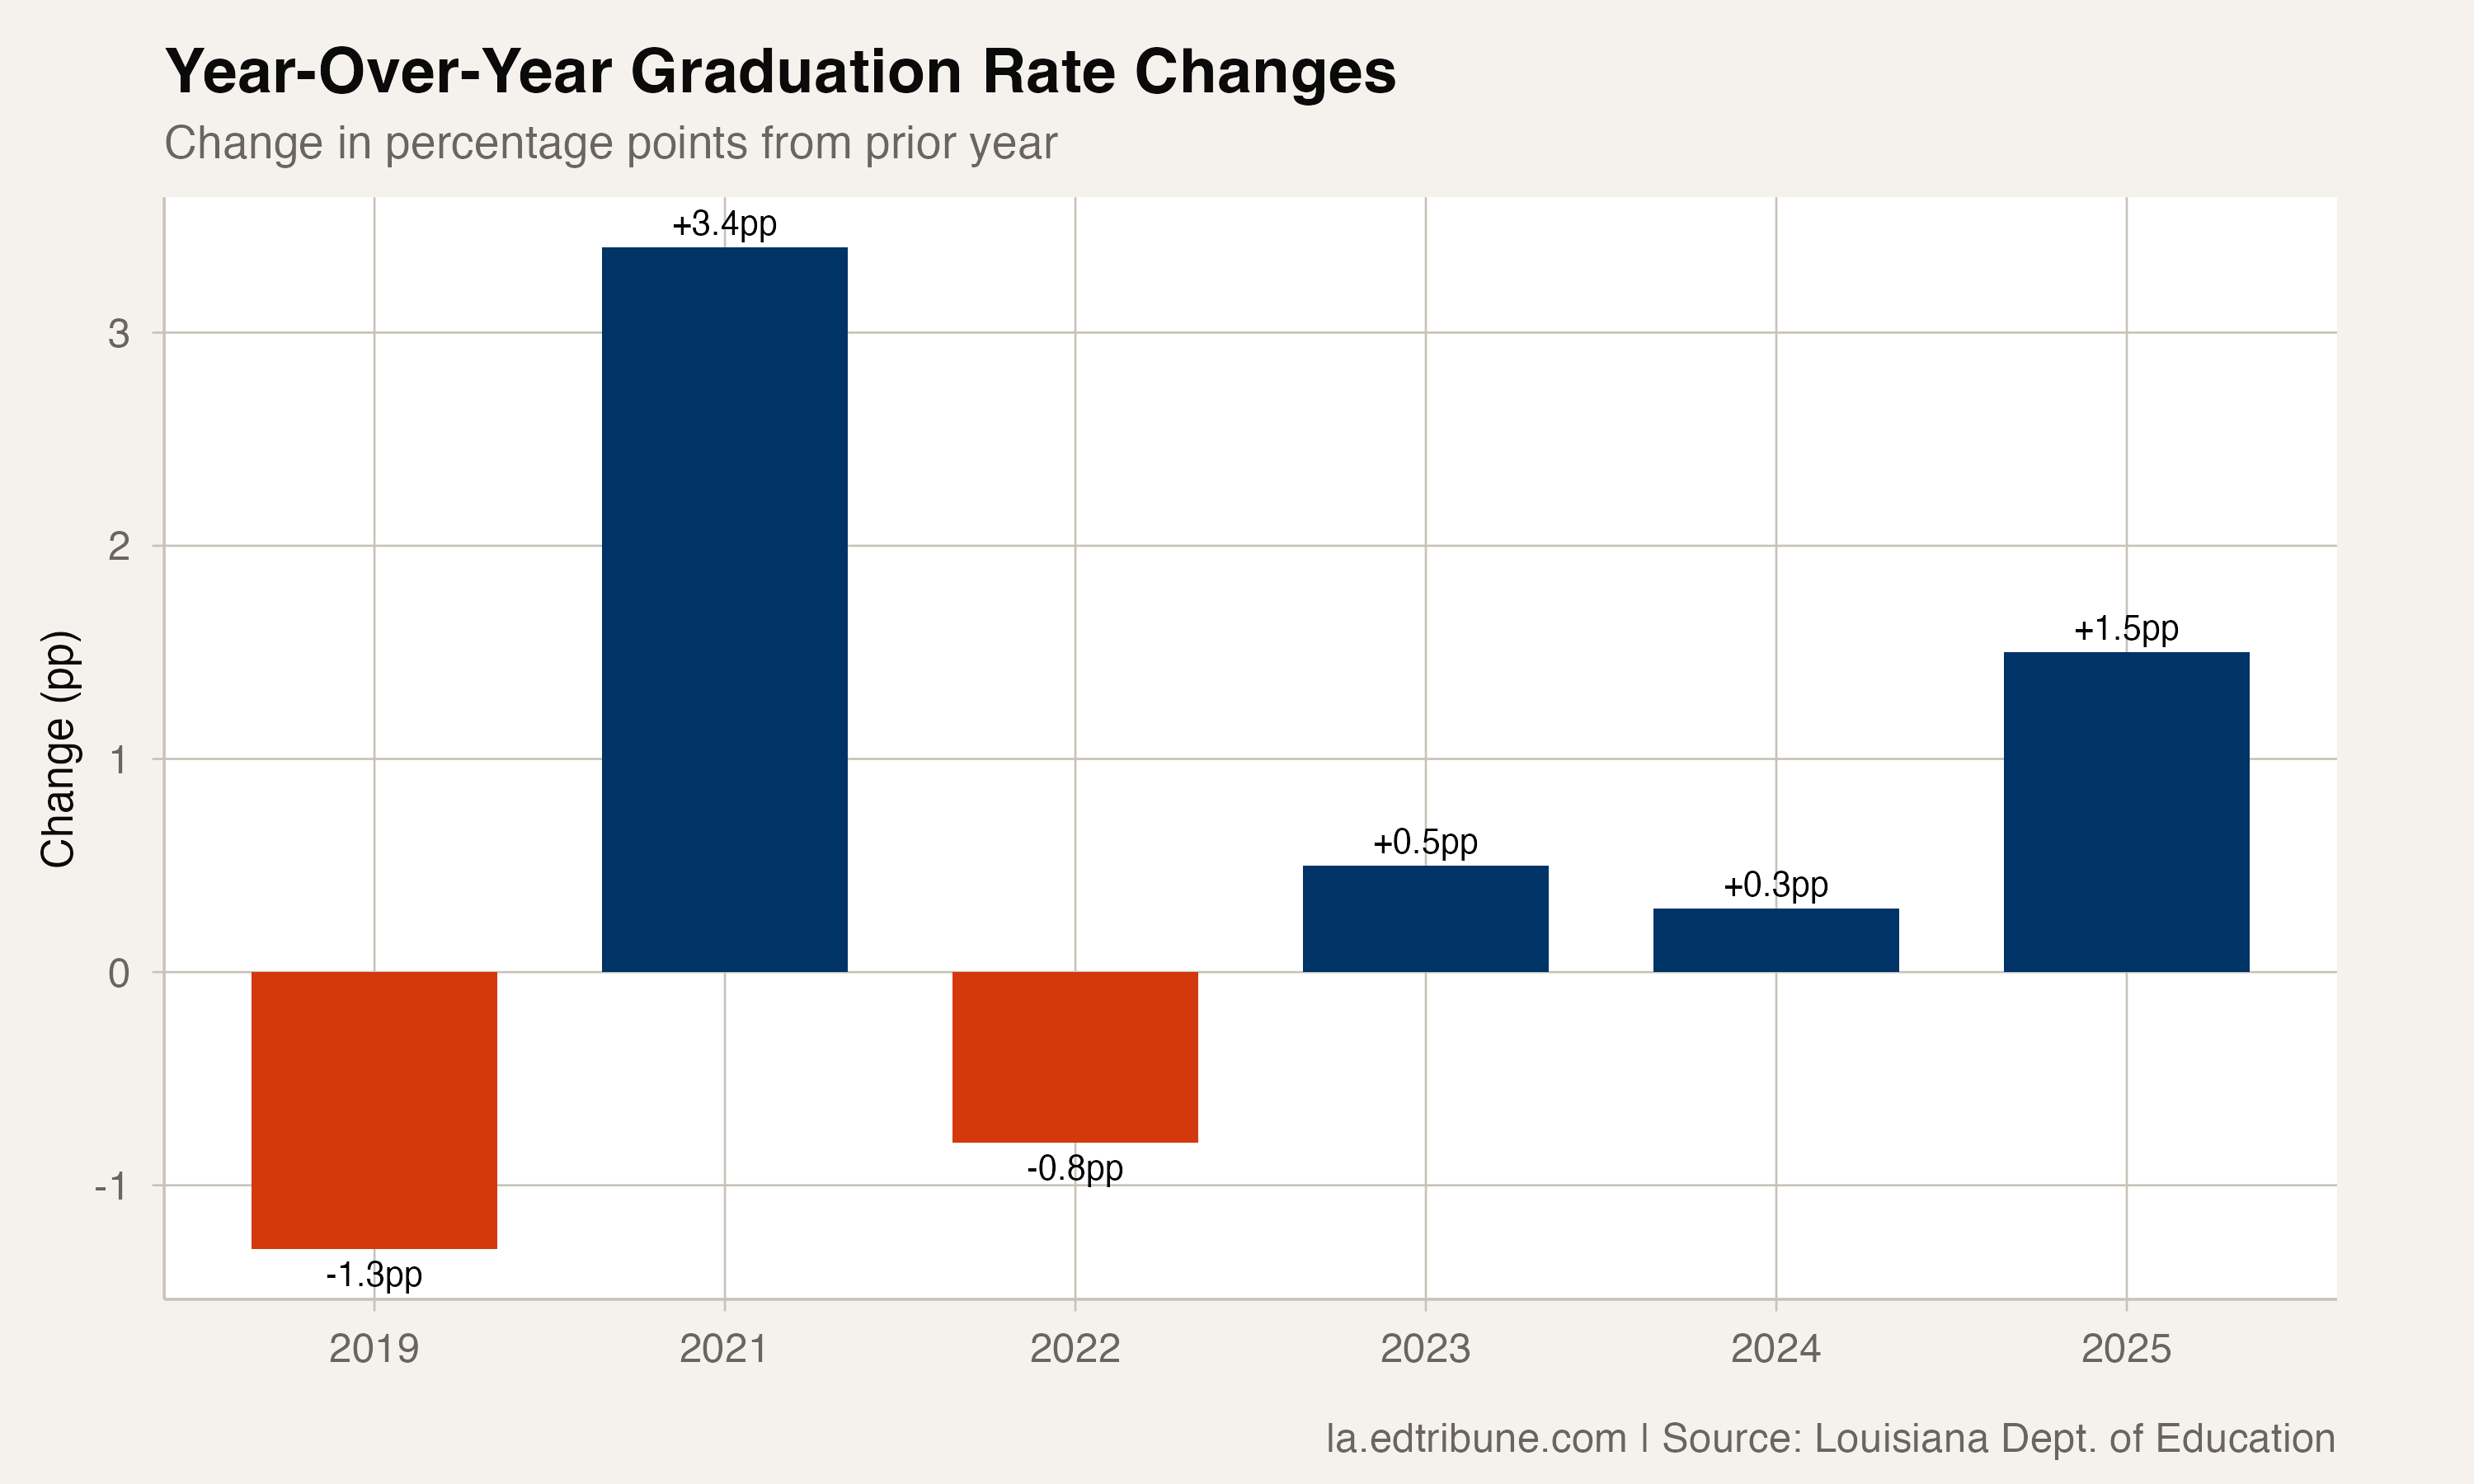
The 2021 bounce was the largest single-year jump at 3.4 points, but that came off the 2019 low with 2020 missing entirely from the data. The 2025 gain of 1.5 points, building on a rate that was already at 83.5%, is arguably the more meaningful milestone because it represents improvement from an established level rather than recovery from a trough.
Where the rate goes from here
Reaching 85% is significant, but it's not exceptional. Louisiana entered the dataset in 2018 behind most states, so the trajectory is one of catching up rather than leading. Whether the rate can sustain its upward path depends on several factors: the pipeline of incoming students (the state has seen K-12 enrollment decline for seven consecutive years), the durability of post-COVID academic recovery, and whether the equity gains among Black and Hispanic students continue closing the remaining gaps.
The 2025 data, though, points clearly upward. The broadest single-year gain, the highest rate on record, and improvement across every major subgroup suggest momentum that extends beyond any single intervention.
Data source
Data from the Louisiana Department of Education. Analysis uses 4-year cohort graduation rates for the 2017-18 through 2024-25 graduating classes. The 2019-20 graduating class is excluded because Louisiana did not publish cohort graduation rates for that year.
Detailed code that reproduces the analysis and figures in this article is available exclusively to EdTribune subscribers.
Discussion
Sign in to join the discussion.
Loading comments...