In this series: Louisiana 2025-26 Enrollment.
St. Helena Parish↗ET reports that 99.6% of its students are economically disadvantaged. East Carroll Parish↗ET reports 98.1%. Across Louisiana, the official figure is 70.1%, meaning 462,765 of the state's 660,349 public school students carry that classification in the 2025-26 school year.
The number is both real and misleading. Louisiana's child poverty is genuine and severe: the state's child poverty rate jumped from 11% to 19% between the 2019-21 and 2022-24 measurement periods, tied with Washington, D.C. for the largest increase in the nation, according to the Annie E. Casey Foundation. But the 70.1% figure in enrollment data is not a poverty rate. It is a product of how Louisiana identifies students for federal meal programs, and the mechanism inflates the count well beyond what census poverty data would suggest.
The program behind the number
The federal Community Eligibility Provision, or CEP, allows schools where at least 40% of students are directly certified for free meals through SNAP, Medicaid, TANF, or foster care to serve free breakfast and lunch to every enrolled student. When a school or district adopts CEP, it stops collecting individual meal applications. Every student in a CEP school is classified as economically disadvantaged in state reporting, regardless of family income.
Louisiana has aggressively adopted CEP, with a record number of eligible schools participating in recent years. The result: parishes where a substantial majority of students genuinely qualify for meal assistance report rates near 100%, because the program's accounting mechanism rounds up.
This distinction matters for policy. When St. Helena Parish↗ET reports 99.6% economically disadvantaged, it does not mean 99.6% of families fall below the federal poverty line. It means the parish adopted CEP, and the reporting system counts every student. The actual poverty rate, while high, is lower. Education Next has called this conflation of CEP participation with poverty measurement the most common mistake in education writing.
A volatile number, not a rising one
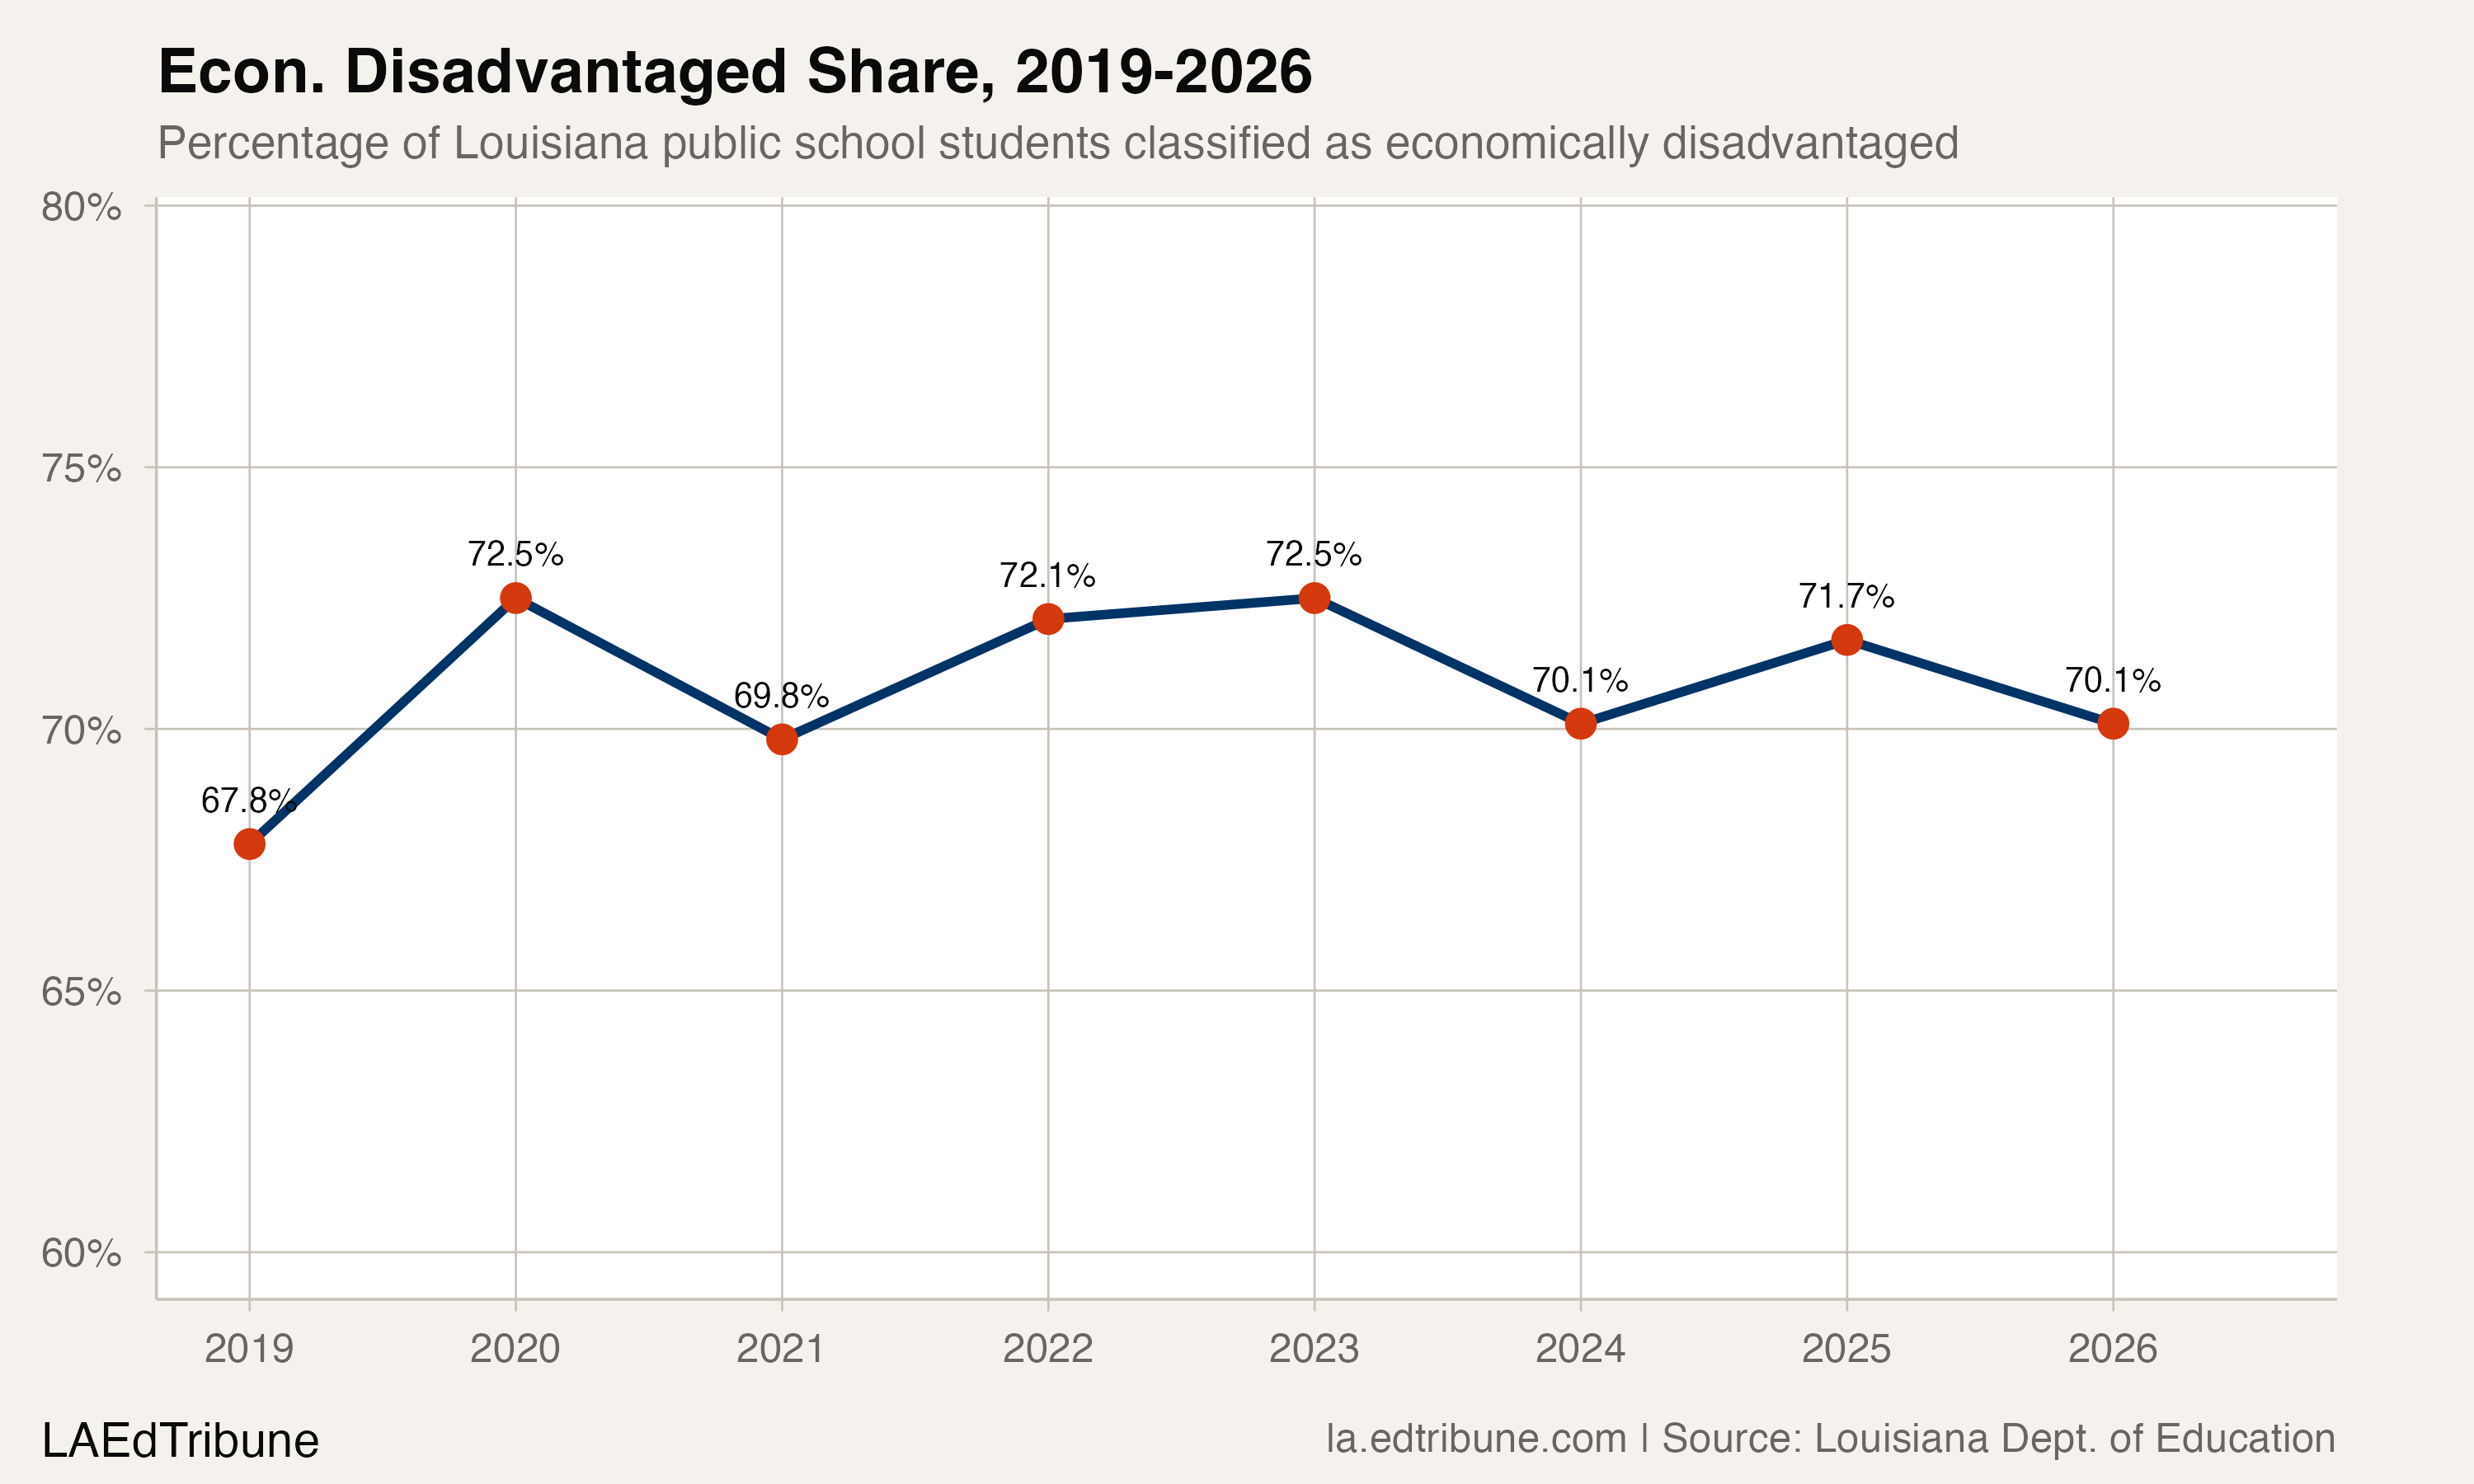
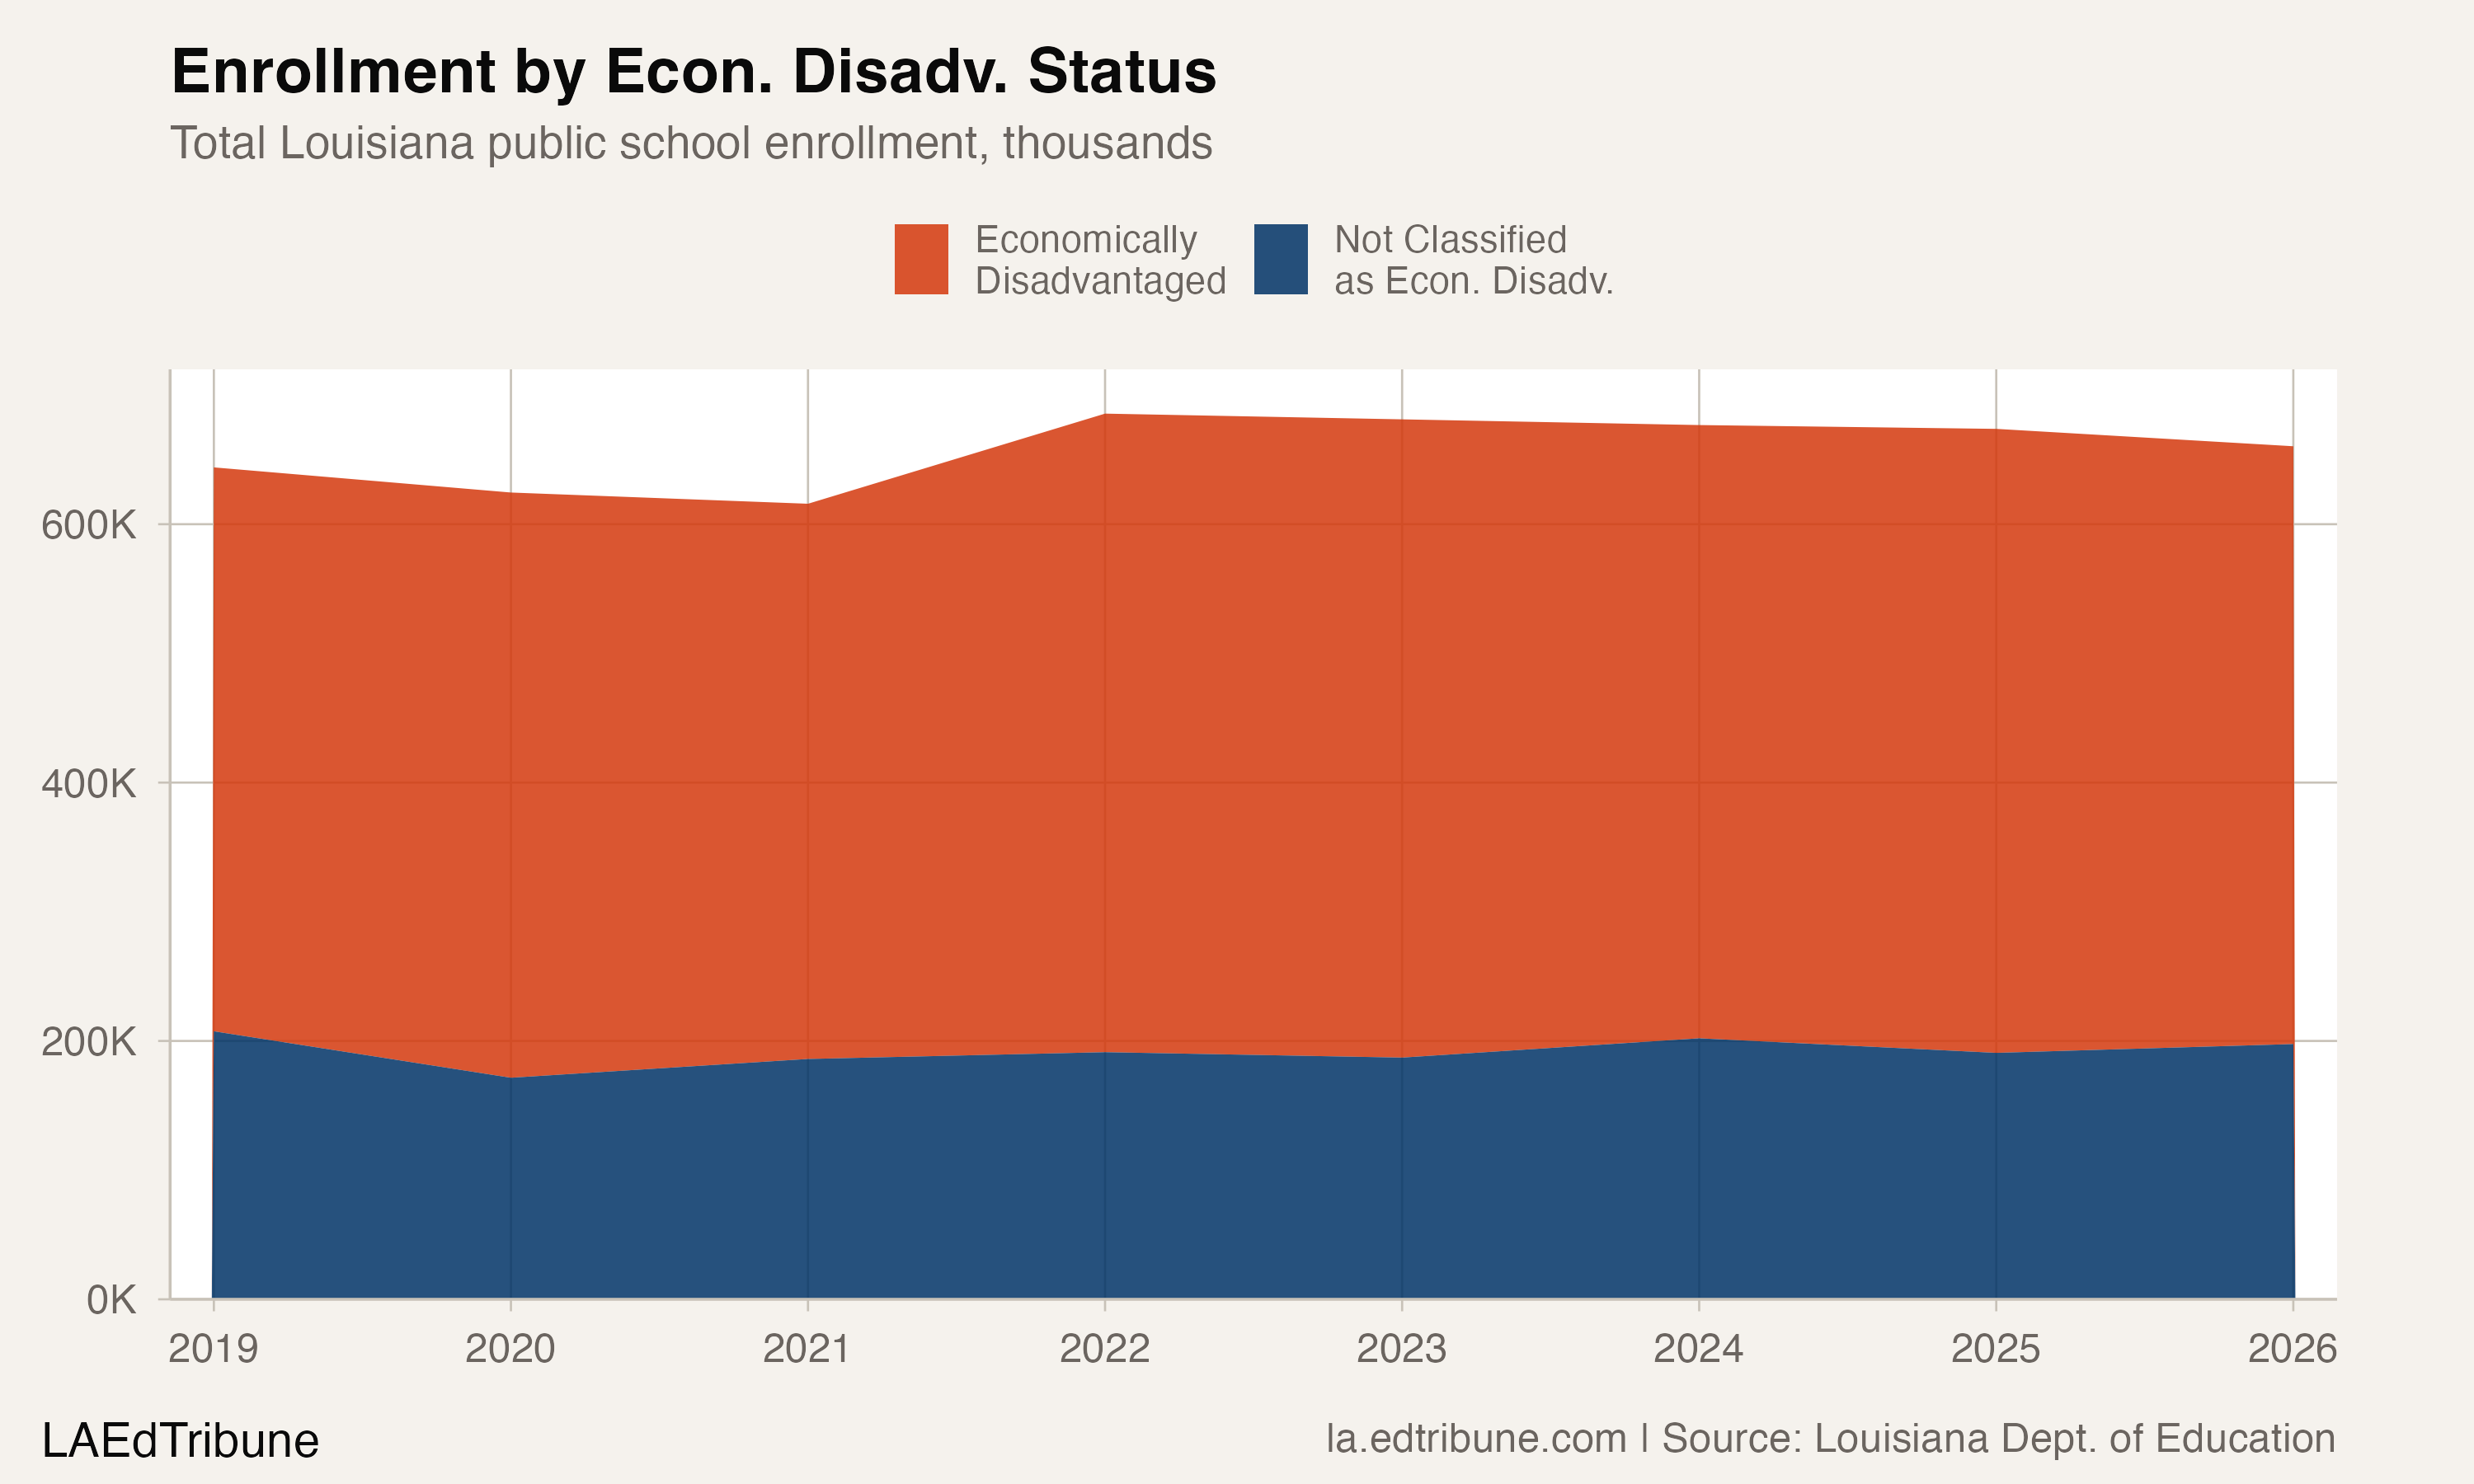
The statewide share has not followed a clear trend. It stood at 67.8% in 2019, jumped to 72.5% in 2020, dropped to 69.8% in 2021, climbed back to 72.5% in 2023, and returned to 70.1% in both 2024 and 2026. The year-over-year swings are large: a 4.8 percentage point increase in 2020, a 2.7 point drop in 2021, then a 2.3 point rise in 2022. These oscillations reflect changes in CEP participation, direct certification matching rates, and the addition of charter entities to the reporting system in 2022, not sudden shifts in how many families are poor.
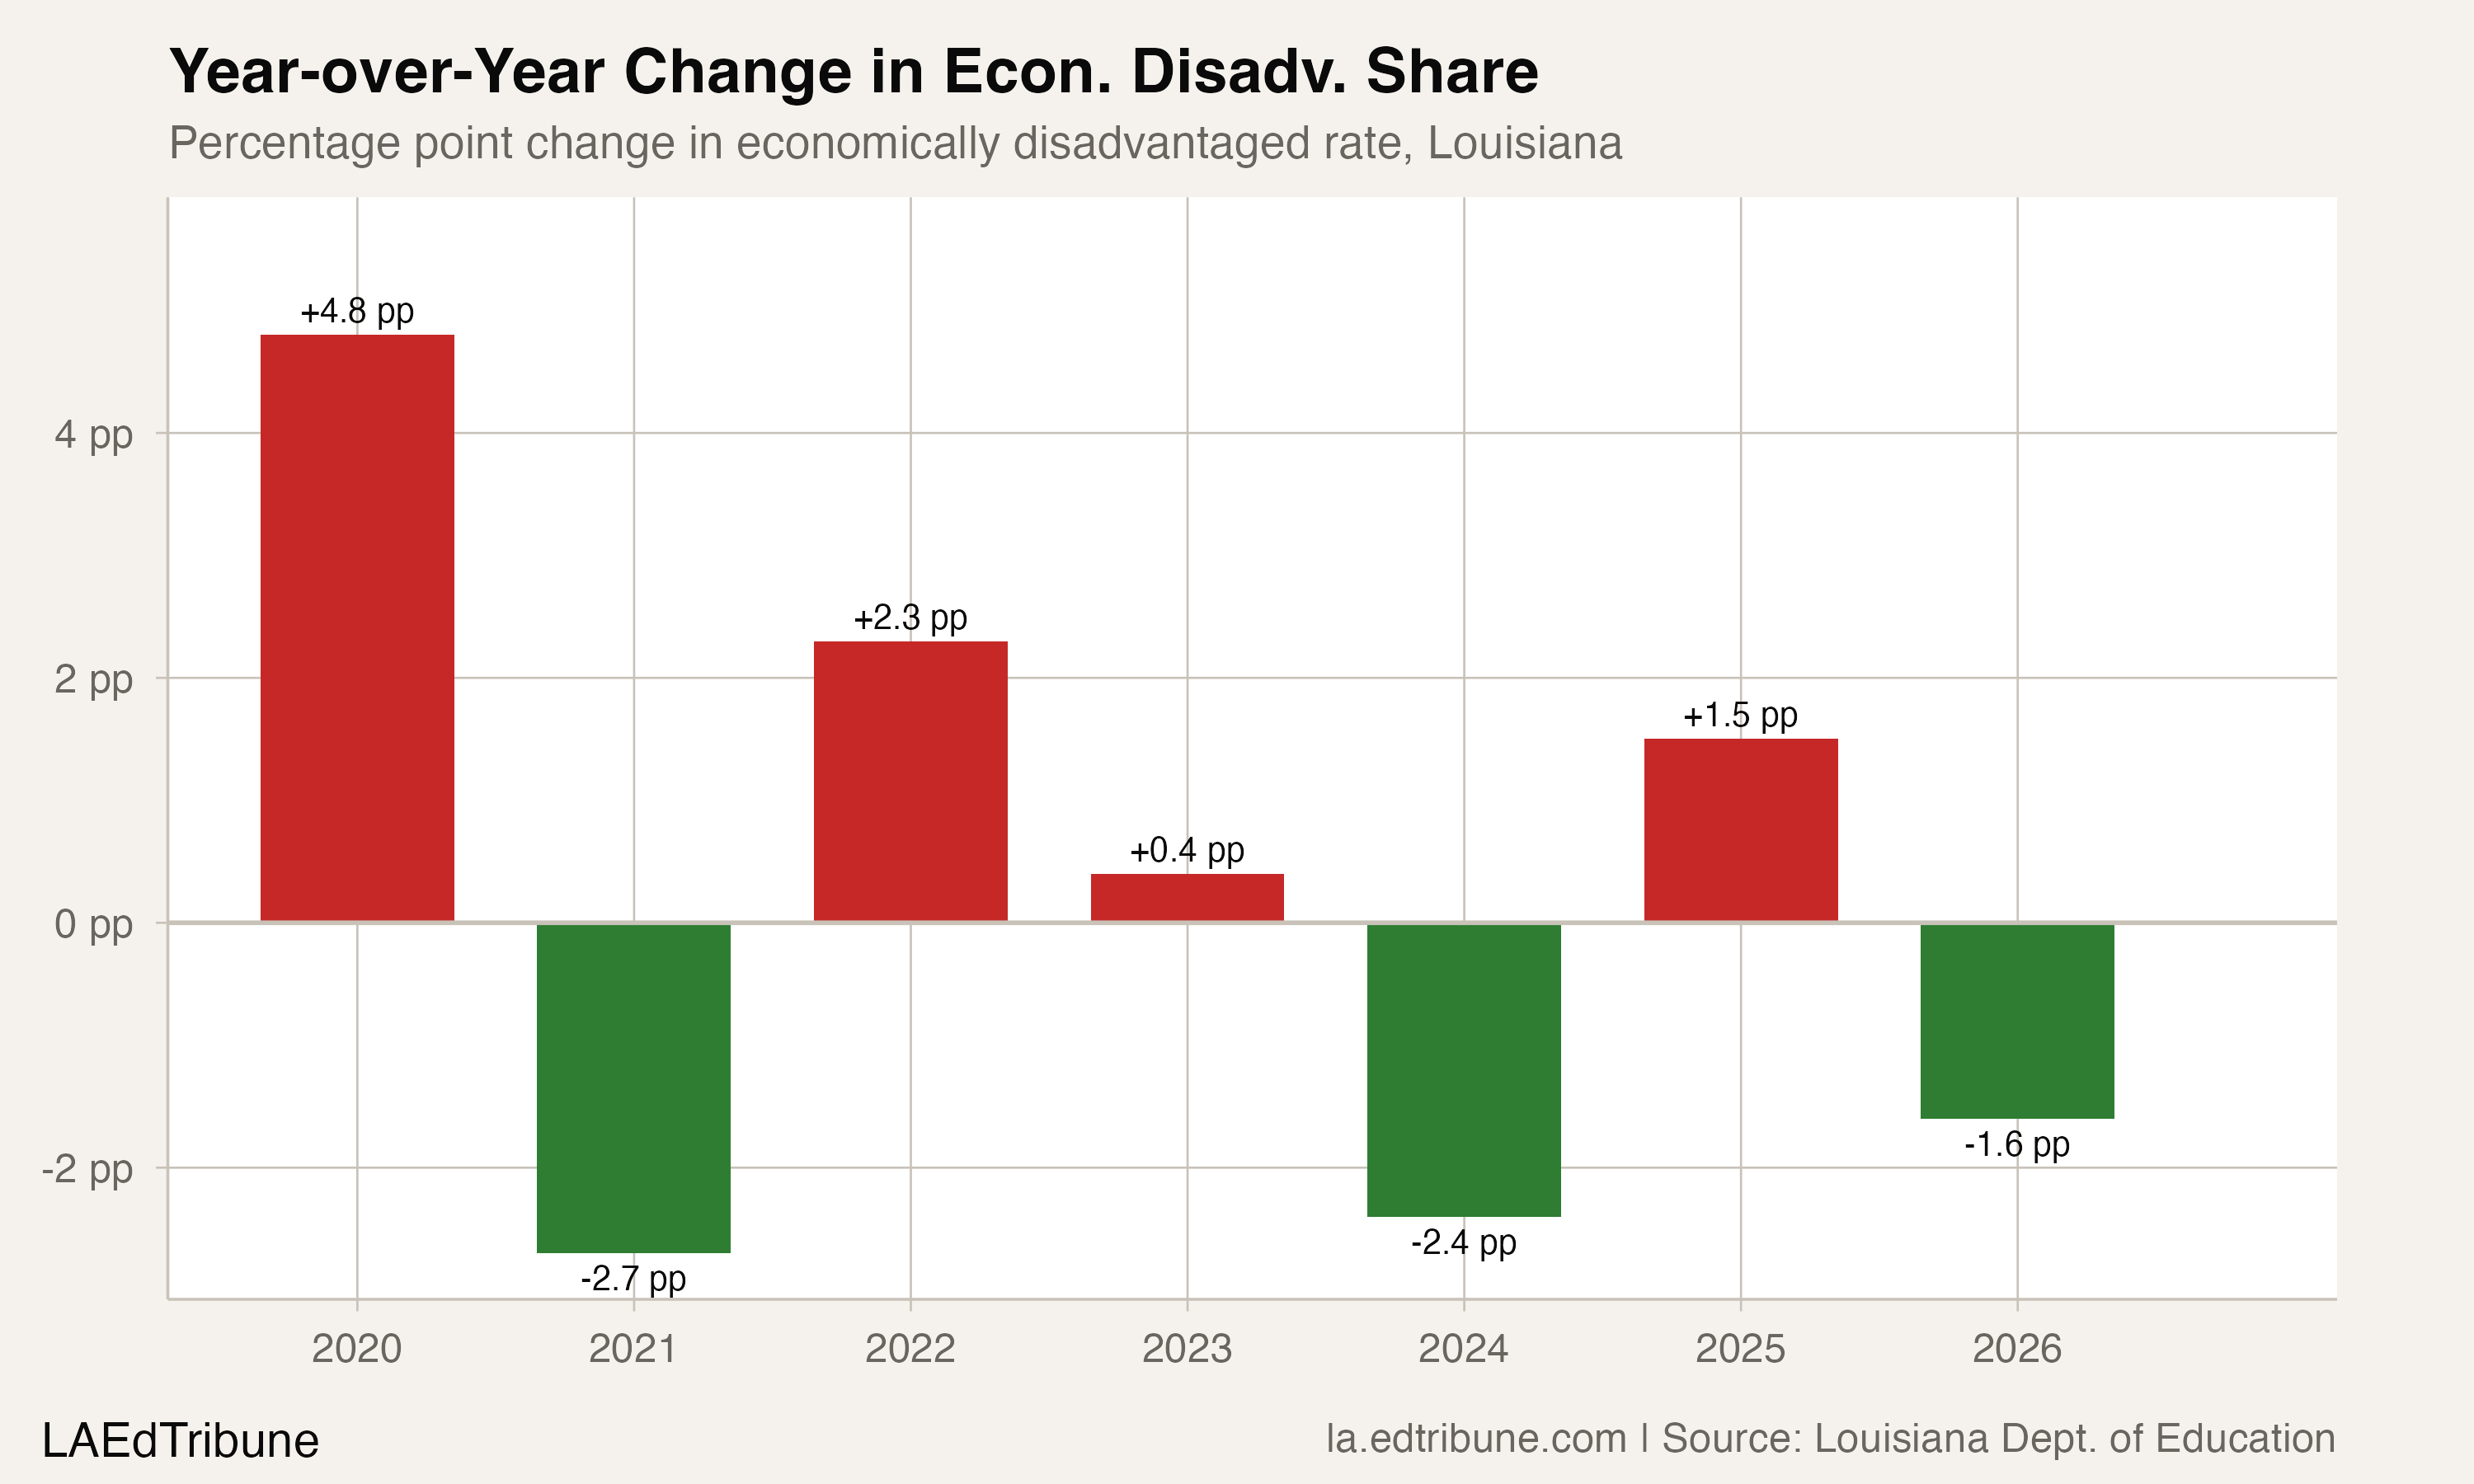
The absolute count tells a similar story. Louisiana classified 436,524 students as economically disadvantaged in 2019 and 462,765 in 2026, a net increase of 26,241, even as overall enrollment grew by only 16,363. The share rose by 2.3 percentage points over the period. But most of that shift occurred in jumps associated with CEP expansion and the 2022 charter reporting change, not as a steady climb tracking worsening poverty.
The 55-point gap between parishes
The gap between the highest- and lowest-rate traditional parishes is enormous. Eight parishes exceed 90% economically disadvantaged: St. Helena Parish↗ET (99.6%), East Carroll Parish↗ET (98.1%), Special School District (96.9%), City of Bogalusa (96.6%), Tensas Parish (95.5%), Madison Parish (95.1%), Thrive Academy (92.9%), and Red River Parish (90.7%). All are CEP districts where every student receives free meals.
At the other end, St. Tammany Parish↗ET sits at 49.2%. Ascension Parish is at 53.5%. Cameron Parish registers 46.7%.
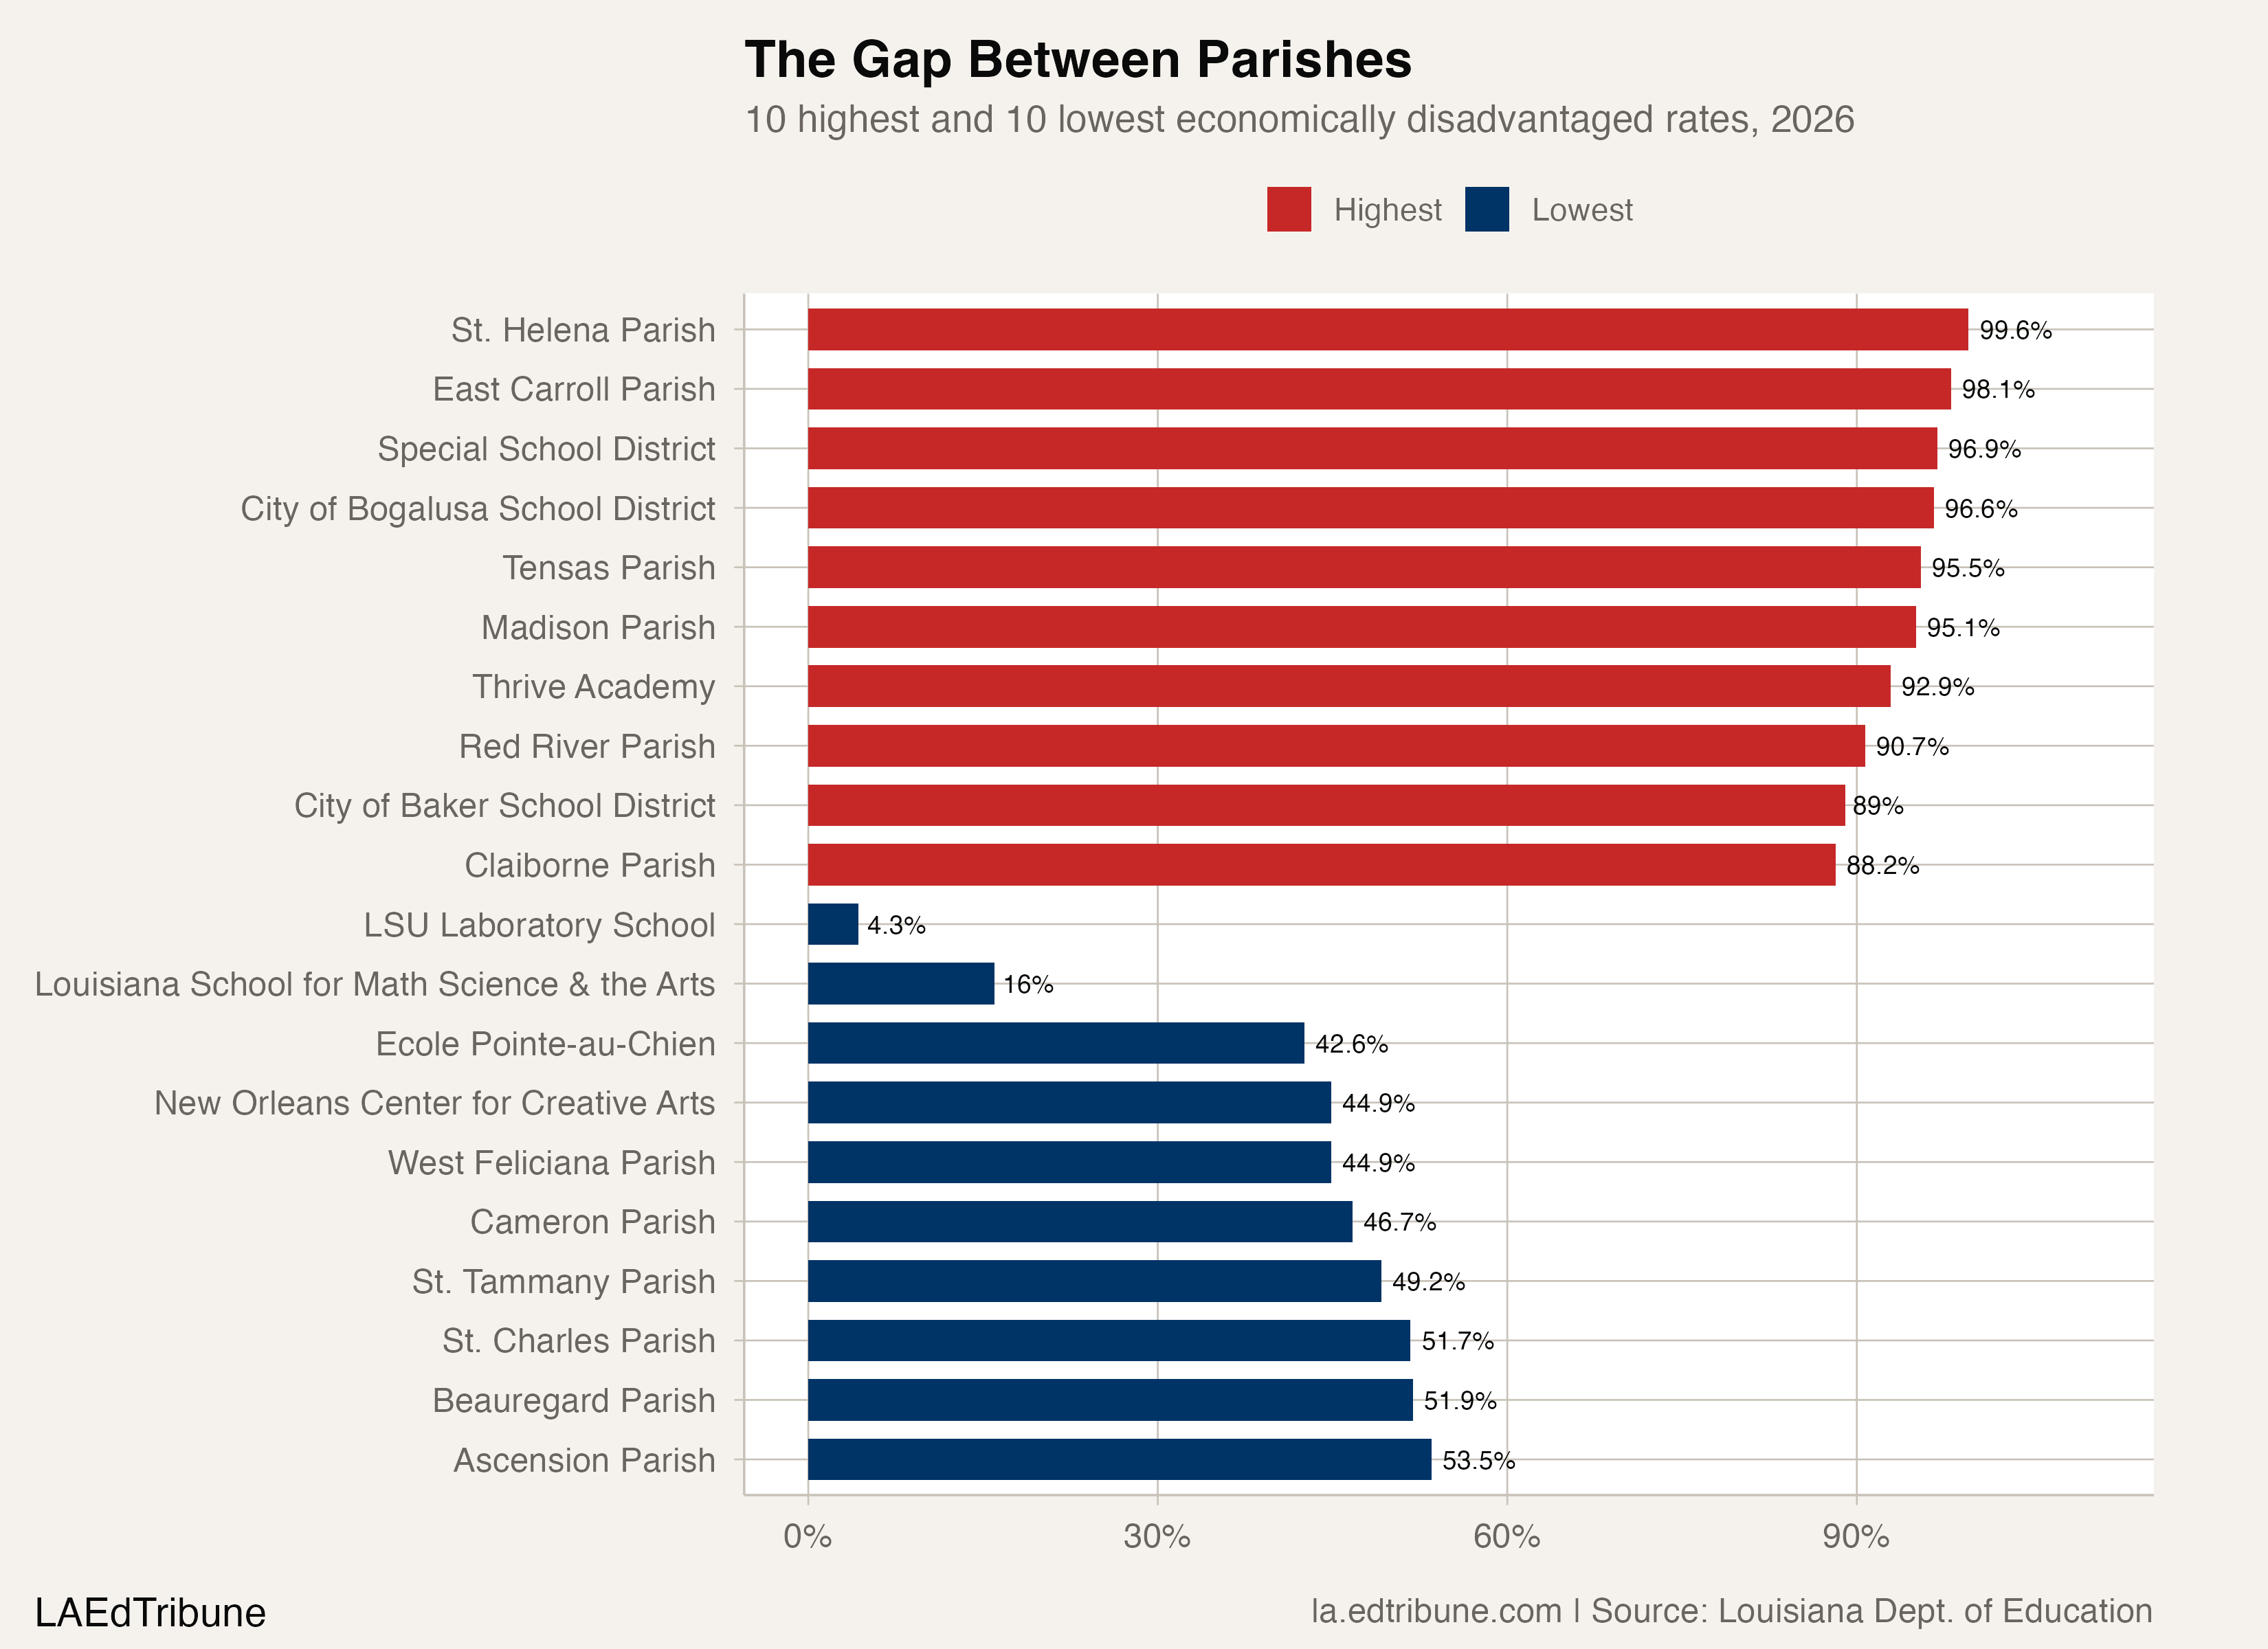
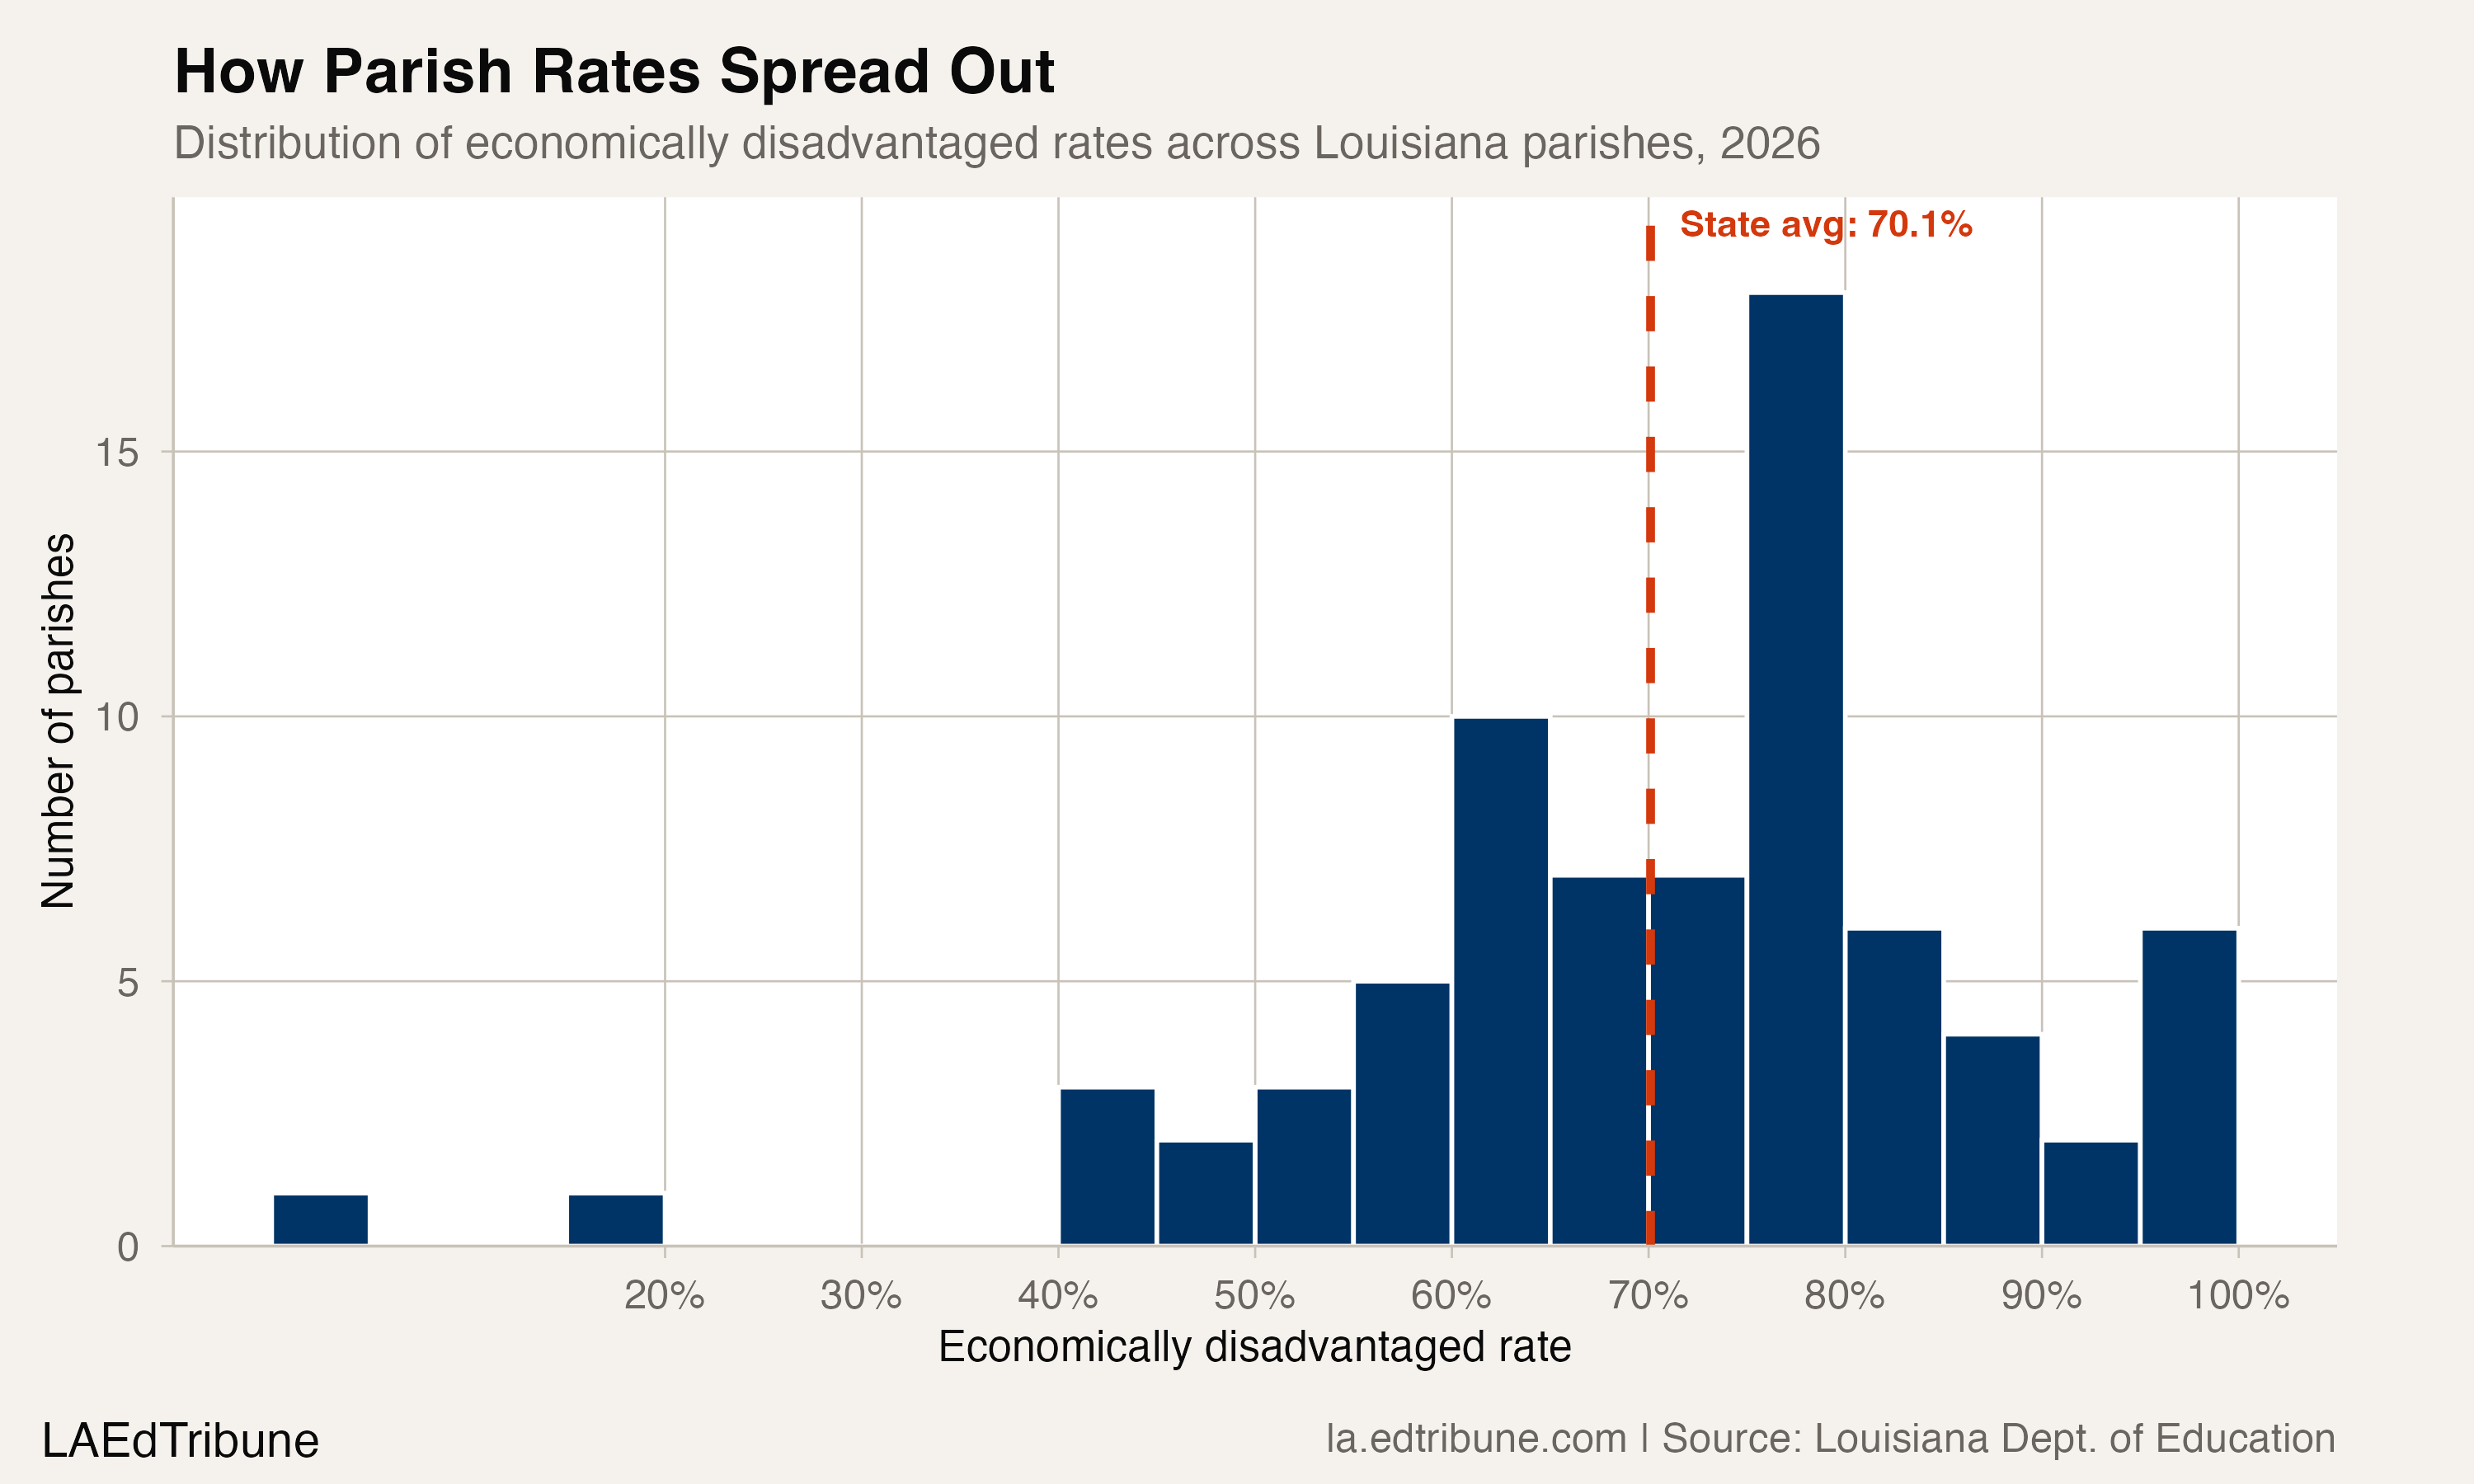
The median parish rate of 73.8% is higher than the statewide 70.1%, because larger, relatively lower-rate parishes like St. Tammany Parish↗ET pull the state average down. Three-quarters of parishes exceed 63.0%. Only seven parishes fall below 50%, and four of those are specialty schools (LSU Lab, the Louisiana School for Math, Science and the Arts, Ecole Pointe-au-Chien, and the New Orleans Center for Creative Arts) with selective admissions that do not reflect geographic poverty.
The biggest surprises are in the suburbs
The most striking parish-level change between 2019 and 2026 is Livingston Parish↗ET, whose economically disadvantaged rate rose 22.4 percentage points, from 54.9% to 77.3%. A jump that large almost certainly reflects a change in CEP participation or direct certification matching, not a sudden doubling of family poverty. When a parish expands community eligibility or improves its data matching with SNAP and Medicaid rolls, its reported rate can jump by double digits in a single year.
Natchitoches Parish climbed 14.6 points. Webster Parish added 10.3 points. In each case, the underlying poverty level was already high. CEP adoption made the reporting system reflect it more comprehensively, and then overshoot it.
Among the state's 10 largest parishes, every one exceeds 49%. East Baton Rouge Parish↗ET leads at 78.0%, followed by Jefferson Parish↗ET at 77.4% and Livingston at 77.3%. Caddo Parish↗ET sits at 73.8%. Even Bossier Parish, part of the Shreveport metro area's suburban ring, registers 55.9%.
What the funding formula sees
Louisiana's Minimum Foundation Program allocates a 22% additional weight for students classified as economically disadvantaged or English learners, on top of the $4,015 base per-pupil amount for 2025-26. Because 70.1% of students carry the economically disadvantaged classification, the weight functions less as targeted supplemental funding and more as part of the base allocation for most parishes. A formula weight that applies to seven out of every 10 students is not really a weight. It is the default.
This creates a specific problem for the parishes at the extremes. St. Helena Parish, at 99.6%, receives the poverty weight for essentially its entire student body. But its per-pupil costs for transportation, facilities, and specialized instruction are also higher than the state average because it is rural and small. The weight was designed to supplement, not to constitute, the funding stream. For parishes above 90%, the distinction has collapsed.
Real poverty, imprecise measurement
None of this means Louisiana's poverty is a statistical fiction. The Annie E. Casey Foundation's 2025 study found roughly 200,000 Louisiana children living in poverty, with the state's single-year child poverty rate reaching 24.8% in 2024. That is the second-worst rate in the country, behind only Mississippi. The expiration of pandemic-era economic relief programs, including expanded child tax credits, contributed to the increase.
The gap between the census poverty rate (24.8%) and the enrollment-data economically disadvantaged rate (70.1%) is the CEP gap. It measures the distance between a program designed to feed children and a data field designed to count poor ones. Louisiana uses the program for the counting, and the result is a number that overstates poverty by nearly three to one while simultaneously masking real variation between parishes.
Louisiana's students are poor at rates that rank among the nation's worst. That is not in dispute. But a reporting system that classifies 99.6% of students in St. Helena and 49.2% in St. Tammany as the same category -- "economically disadvantaged" -- collapses a 55-point gap into a single checkbox. The Minimum Foundation Program assigns the same 22% funding weight to both. St. Helena, where the nearest grocery store is a 30-minute drive and the school doubles as the community center, receives the same per-pupil supplement as a St. Tammany school where half the families could comfortably pay full price for lunch. The data says seven in 10 Louisiana students need extra help. The money arrives as though they all need the same amount.
Detailed code that reproduces the analysis and figures in this article is available exclusively to EdTribune subscribers.
Discussion
Sign in to join the discussion.
Loading comments...